You are here
Ports’ criticality in international trade and global supply-chains
Ports’ criticality in international trade and global supply-chains
J. Verschuur, E. E. Koks & J. W. Hall 27 July 2022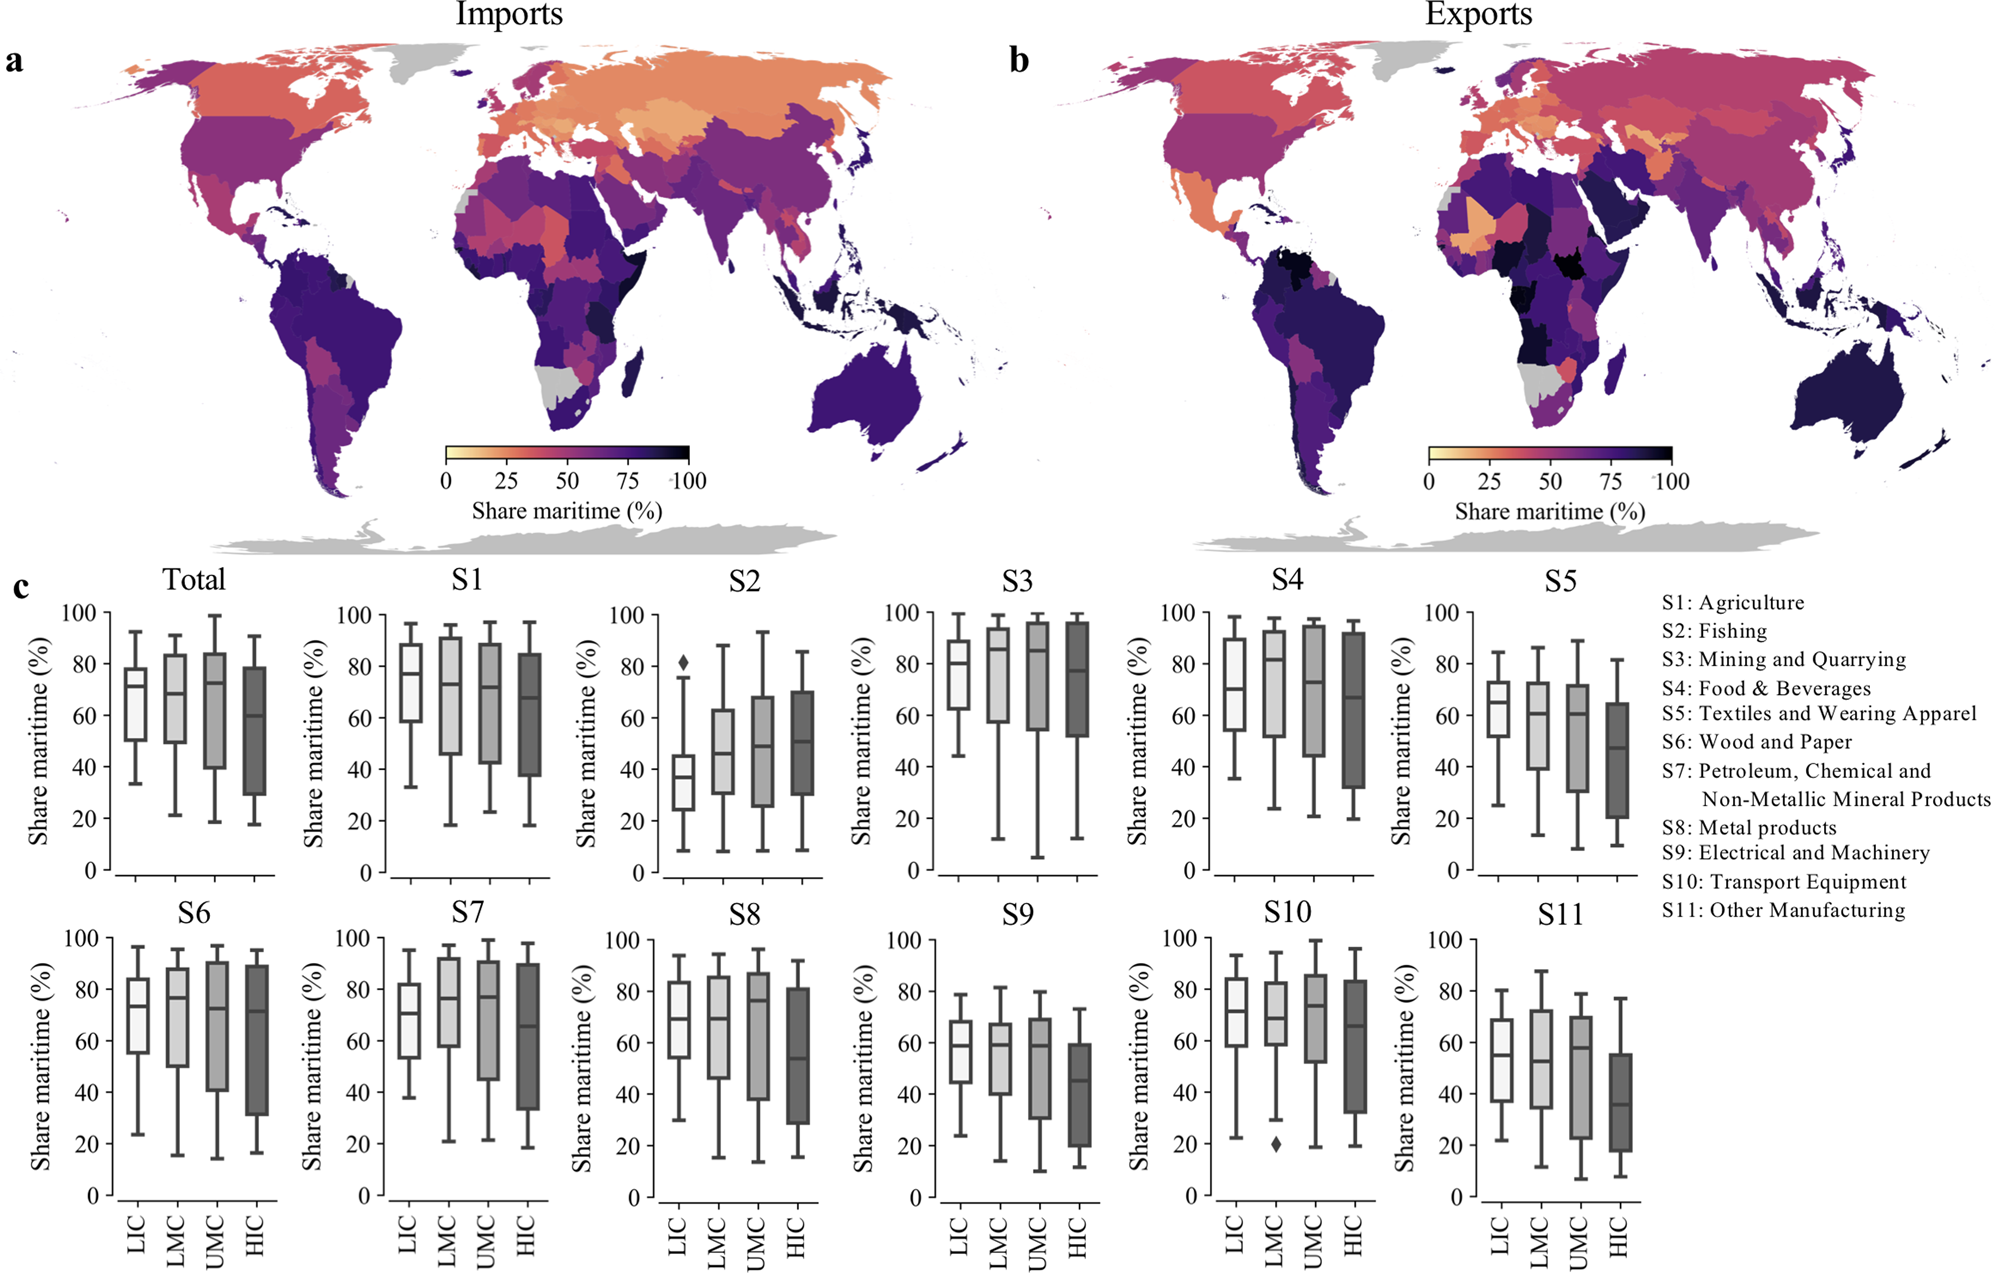
Abstract
We quantify the criticality of the world’s 1300 most important ports for global supply chains by predicting the allocation of trade flows on the global maritime transport network, which we link to a global supply-chain database to evaluate the importance of ports for the economy. We find that 50% of global trade in value terms is maritime, with low-income countries and small islands being 1.5 and 2.0 times more reliant on their ports compared to the global average. The five largest ports globally handle goods that embody >1.4% of global output, while 40 ports add >10% of domestic output of the economies they serve, predominantly small islands. We identify critical cross-border infrastructure dependencies for some landlocked and island countries that rely on specific ports outside their jurisdiction. Our results pave the way for developing new strategies to enhance the resilience and sustainability of port infrastructure and maritime trade.
Introduction
Maritime transport is considered the backbone of international trade and the global economy1,2,3. With ports supporting the integration of production centres and consumer markets across borders4, there are large dependencies and feedbacks between changes in the size and structure of the economy (e.g. trade composition, supply-chain structure) and the expected freight flows through specific ports5,6. Similarly, changes (e.g. new infrastructure investments) or disruptions (e.g. port closures) to the maritime transport network can have implications for supply-chains across multiple countries and industries7.
The maritime transport and global supply-chain networks interact with one another on different spatial scales, with recent events illustrating the tight coupling between the two. On the largest spatial scale, the global trade network, the demand for maritime trade is driven by countries’ demand for trade, those countries supplying this trade, and the share of trade being maritime (i.e. modal split). Hence, relative changes in freight flows reflect changes in trade demand, supply and modal split. The COVID-19 pandemic, which affected port operations across the world, changed both demand and supply patterns simultanously8. On the one hand, this disrupted maritime transport and supply-chains due to factory shutdowns, port closures and labour shortages9, while on the other hand this led to large trade bottlenecks at many ports due to shifting demand patterns10. Freight demand on the underlying maritime transport network, consisting of maritime routes that connect ports, is determined by the geographical demand for transport services and the network structure of system. For certain commodities this network is known to be more centralised (e.g. containers) while for others this is more decentralised (e.g. bulk transport)11. The 2021 Suez blockage highlighted how a large shock to a specific route within the maritime transport network could affect multiple ports across the globe, and eventually supply-chains depending on these ports12. Ultimately, trade flows handled at the port serve supply-chains across different hinterlands, either directly (e.g. firm directly receiving goods from ports) or indirectly (e.g. firm depending on other firms that receive goods from ports). For instance, Hurricane Katrina (2005), shutting down major Louisiana ports, led to large disruptions to the global grain supply, resulting in export losses for the United States, which rippled to dependent supply-chains globally and raised commodity prices13,14.
The criticality, that is the systemic (i.e. network-based) importance, of ports for the economy is often framed in terms of the absolute amount of trade flowing through a port, its network characteristics within the maritime transport network (e.g. node centrality)11,15,16, or in terms of its contribution to the local or regional economy (e.g. regional employment and value-added)17. These framings, however, ignore the primary function of ports as the physical infrastructure that connects supply-chains across countries1,4, and therefore fail to provide a comprehensive picture of the dependencies and feedbacks between ports and the economy.
Establishing a fine-scale representation of how each individual industrial sector, globally, makes use of maritime transport, and, on the other hand, how individual ports are critical to global supply chains can help us rethink the importance of ports, which can be informative for different disciplines. For instance, it could allow a better understanding of the geographical distribution of physical trade flows across supply-chains18,19, connect environmental footprints with commodity flows20,21, predict future port demand (in terms of volume and space required) as economies grow22, help allocate maritime emissions (~2.6% global greenhouse gas emissions in 2012) to countries and sectors23,24, and assess the potential supply-chain losses due to maritime transport disruptions25,26.
So far, a number of macroeconomic studies have examined the evolution of international trade and supply-chain interconnectivity27,28,29. This analysis is backed by advances in the provision of Multi-Regional Input–Output (MRIO) tables that describe the inter-, and intra-industry dependencies within countries and between countries30,31,32,33. Although MRIO tables provide extensive data on inter-, and intra-industry trade flows, at national and regional scales, it does not provide insights into the domestic and international transportation systems that are used for these trade flows. Another strand of literature has analysed the network structure and evolution of maritime transport networks through a complexity science lens11,15,34,35,36,37,38,39. This research, however, focused solely on the shipping connections between ports, without incorporating information on the goods that are carried by maritime vessels, where goods are coming from and going to, and how goods are used in the economy. Hence, to date, there is still a spatial mismatch between information describing the structure of the global economy (i.e. global trade and supply-chain data) and a bottom up representation of the transportation network used (i.e. observed maritime transport flows) to facilitate this economic structure.
Here, we present a new modelling framework that provides a comprehensive understanding of the different dimensions of the criticality of ports for domestic and global economies (e.g. on the trade, transport and supply-chain level) that are not captured in aggregate port-level trade statistics. To do this, we provide a globally consistent assessment of the links between ports and maritime trade, the transport networks they utilise (1378 ports across 207 countries), and the supply-chains they serve (1298 ports across 176 countries) (see Methods). This is achieved by first estimating the fraction of maritime trade in all bilateral trade flows and feeding this into the newly developed Oxford Maritime Transport (OxMarTrans) model that simulates the maritime and hinterland routes taken to transport maritime trade flows. The trade flows going through ports are then linked to a global supply-chain database (EORA MRIO tables32) to quantify the links and feedbacks between ports and the economy.
We find that around 50% of global trade (in value terms) is maritime, which reaches up to 76% for the mining and quarrying sector. Low income countries and small island developing states (SIDS) rely disproportionally on maritime trade: their maritime import fraction is 1.5 and 2.0 times higher, respectively, than the global average. Every USD flowing through a port contributes on average 4.3 USD in value to the global economy. We identify ports being critical for the global and domestic economy, showing how the top 5 macro-critical ports all handle goods that contribute >1.4% to the global economy, while 40 ports handle goods that represent >10% of the value of the domestic economies they serve (i.e. domestically critical ports). In addition, we find that every 1000 USD increase in final demand (i.e. the goods needed to meet final consumption and exports) results in a median 84.6 USD increase in maritime imports across the ports that serve these economies, with 30 individual ports experiencing >100 USD increase. Our results pave the way for a better understanding of the key links, dependencies and feedbacks between port, the maritime infrastructure network and the global economy, which is essential information for sustainable infrastructure planning.
Results
Overview
The results summarise the model output on the different layers; the trade network layer, the transport network layer, and the port supply-chain layer. These three layers are conceptualised in Supplementary Fig. 1. The trade network layer results discuss the output of the global modal split model (i.e. the distribution of trade flows across transport modes) that quantifies the variations in a country’s dependency on maritime trade as a fraction of total trade on a commodity level. The transport network layer results outline several output of the OxMarTrans model. The OxMarTrans model simulates the route choice of millions of maritime freight flows between 3400 regions across 207 countries on the hinterland and maritime transport network. The output includes the aggregate global freight flows on the transport network and through the two main canals (Suez and Panama), the dependency of countries on maritime infrastructure in foreign jurisdictions through land-based connections and transhipments, the port-level trade flows, and the trade flow distribution across all ports. To quantify the domestic and global economic dependencies on trade flows through ports (i.e. the port supply-chain layer), we use the EORA MRIO tables32 that we extend to the port-level to link the commodities that flow through ports the global supply-chains they serve. Two metrics are constructed to capture these dependencies; (1) the port-level output coefficient (PLOC) and (2) the port-level import coefficient (PLIC). The base year considered in this analysis is 2015, which is the latest available year in the EORA MRIO database (at the time of writing). Throughout this study, we adopt a 11 sector industry classification in line with the EORA MRIO to evaluate differences in criticality between sectors (Supplementary Table 1).
Share of maritime transport in global trade
Within the trade network layer, the amount of maritime trade between countries is determined by the absolute value of trade across all modes between country pairs and the share of this being maritime. Our transport modal split model estimates the share of maritime trade for around 8 million bilateral trade flows globally on a commodity level (HS6). It should be noted that in this study the mode of transport is defined as the dominant transport mode (longest distance) in the supplier-consumer connection, which means that landlocked countries can still rely on maritime transport (see Methods).
We estimate that 9.4 billion tonnes of trade, equivalent to around 7.6 USD trillion in value terms, was maritime in 2015. The share of maritime trade in global trade is around 75% in terms of weight and 50% in terms of value. This number corresponds well with the estimated 9.96 billion tonnes of trade being discharged in ports in 2015 as reported by UNCTAD40. However, large differences exist between sectors. For instance, while 75.7% (86.0%) of Mining and Quarrying (sector 3) products are transported by means of maritime transport in value (weight) terms, most manufacturing sectors (sector 4 to 11) transport only 40% – 57% (53% – 60%) of their trade in value (weight) terms using maritime transport.
Figure 1 shows the percentage of maritime transport in total imports (Fig. 1a) and total exports (Fig. 1b) per country, while Supplementary Figs. 2 and 3 display the same results per economic sector considered. The dominance or absence of maritime transport for trade is mainly determined by the geographical location of trading partners (e.g. distance, island state), the presence of alternative (fast and cheaper) modes, the value to weight ratio of the commodities, and the standard of living of the importing country (e.g. quality of logistics services)41.
Fig. 1: The share of maritime transport in global trade.
figure 1
Country’s percentage of maritime imports (a) and exports (b) based on the 2015 trade network. c Boxplots of the percentage maritime imports per economic sector with countries grouped by income level (based on the World Bank income classification). LIC: Low income countries, LMC: Lower middle income countries, UMC: Upper middle income countries, HIC: High income countries.
Full size image
As can be seen from Fig.1, Caribbean islands, countries in Oceania and some countries in Africa (e.g. Somalia, Nigeria, Gabon) rely disproportionally on maritime transport for both imports and exports (Fig. 1a, b). European countries, in particular landlocked countries (e.g. Romania, Hungary, Switzerland), have a much lower share of maritime transport, mainly due to the large trade flows between European countries that use road, rail and inland waterway transport to move goods over relatively short distances42,43. Middle-Eastern (Saudi Arabia, United Arab Emirates) and South American (e.g. Brazil, Colombia) countries rely more on maritime transport for their exports compared to their imports. These countries mainly export raw materials (e.g. oil, coal, grain) which is predominantly shipped by maritime vessels, but import a more diversified mix of goods that are transported by multiple modes. Small Island Developing States (SIDS) rely disproportionally on maritime transport, with 86.5% of imports and 79.8% of exports being maritime, thus almost twice as much as non-SIDS countries. SIDS are often served by a only a few maritime transport routes and experience high transportation costs44, making reliable maritime transport services critical for the well-functioning of SIDS’ economies.
Figure 1c shows the share of maritime transport in total and sector-specific imports grouped by the income level of countries (using the 2021 World Bank classification). Low income countries import on average 1.5 times more by means of maritime transport compared to high-income countries (68% versus 45%). The difference is largest for the manufacturing sectors (sector 8 to 11), having maritime shares 1.5 – 1.8 times higher than high income countries. This difference can be explained by the fact that low income countries often trade low value bulk goods, for which maritime transport is the only viable option, and relatively few high valued goods that are more often transported by aeroplane45. Even within the same continent, such as in Africa, maritime transport is often the only feasible mode of transport for certain goods as the road infrastructure lacks the reliability and capacity for efficient trucking, and border crossings can be time consuming46,47. Therefore, the integration of low income countries into complex manufacturing supply-chains, which critically depend on just-in-time logistics services48, could be hindered by their overreliance on maritime transport, which is considerably slower than air transport49,50.
Global maritime transport flow allocation
The maritime transport network, consisting of ports and maritime routes transporting goods using different vessel types (e.g. tankers, containers), connects the locations of production to their demand markets. The OxMarTrans model predicts which ports and maritime routes, including locations of transhipments, are being used to transport the maritime trade flows between each country pair and per economic sector (see Methods). The underlying hinterland and maritime consists of 1378 ports, with the port connections and maritime network capacities incorporated in the model based on a dataset of observed ship activities from Automatic Identification System (AIS) data9. The OxMarTrans model therefore helps identify the spatial connectivity of ports; the maritime subnetwork that is used to transport goods from and to a specific port (we show the spatial connectivity for nine ports in Supplementary Fig. 4).
Globally, to meet maritime trade demand, we estimate that 90.5 trillion tonnes-km of freight is transported across sea and an additional 33.4 trillion tonnes-km over land to connect hinterlands to ports. The maritime freight predicted by the model consistent with the 84 trillion tonnes-km estimated by UNCTAD40. 43% of the total maritime tonnes-km is attributed to the Mining and Quarrying sector (sector 3) alone, while the manufacturing of Electrical and Machinery products (sector 9), Transport Equipment (sector 10) and Other Manufacturing goods (sector 11) together account for only 2.7% of total tonnes-km. Supplementary Fig. 5 shows the total throughput (sum of import, export and transhipment) per port and estimated flows on the maritime transport network, while Supplementary Fig. 6 shows a similar result per sector.
continue reading...https://www.nature.com/articles/s41467-022-32070-0

Subscribe to The Seafarer Times RSS Feeds
User login
Who's online
There are currently 0 users online.